Initial Steps
4 minute read
The initial steps for creating a report will be explained using the example of a report that lists all computers.
Creating the Report
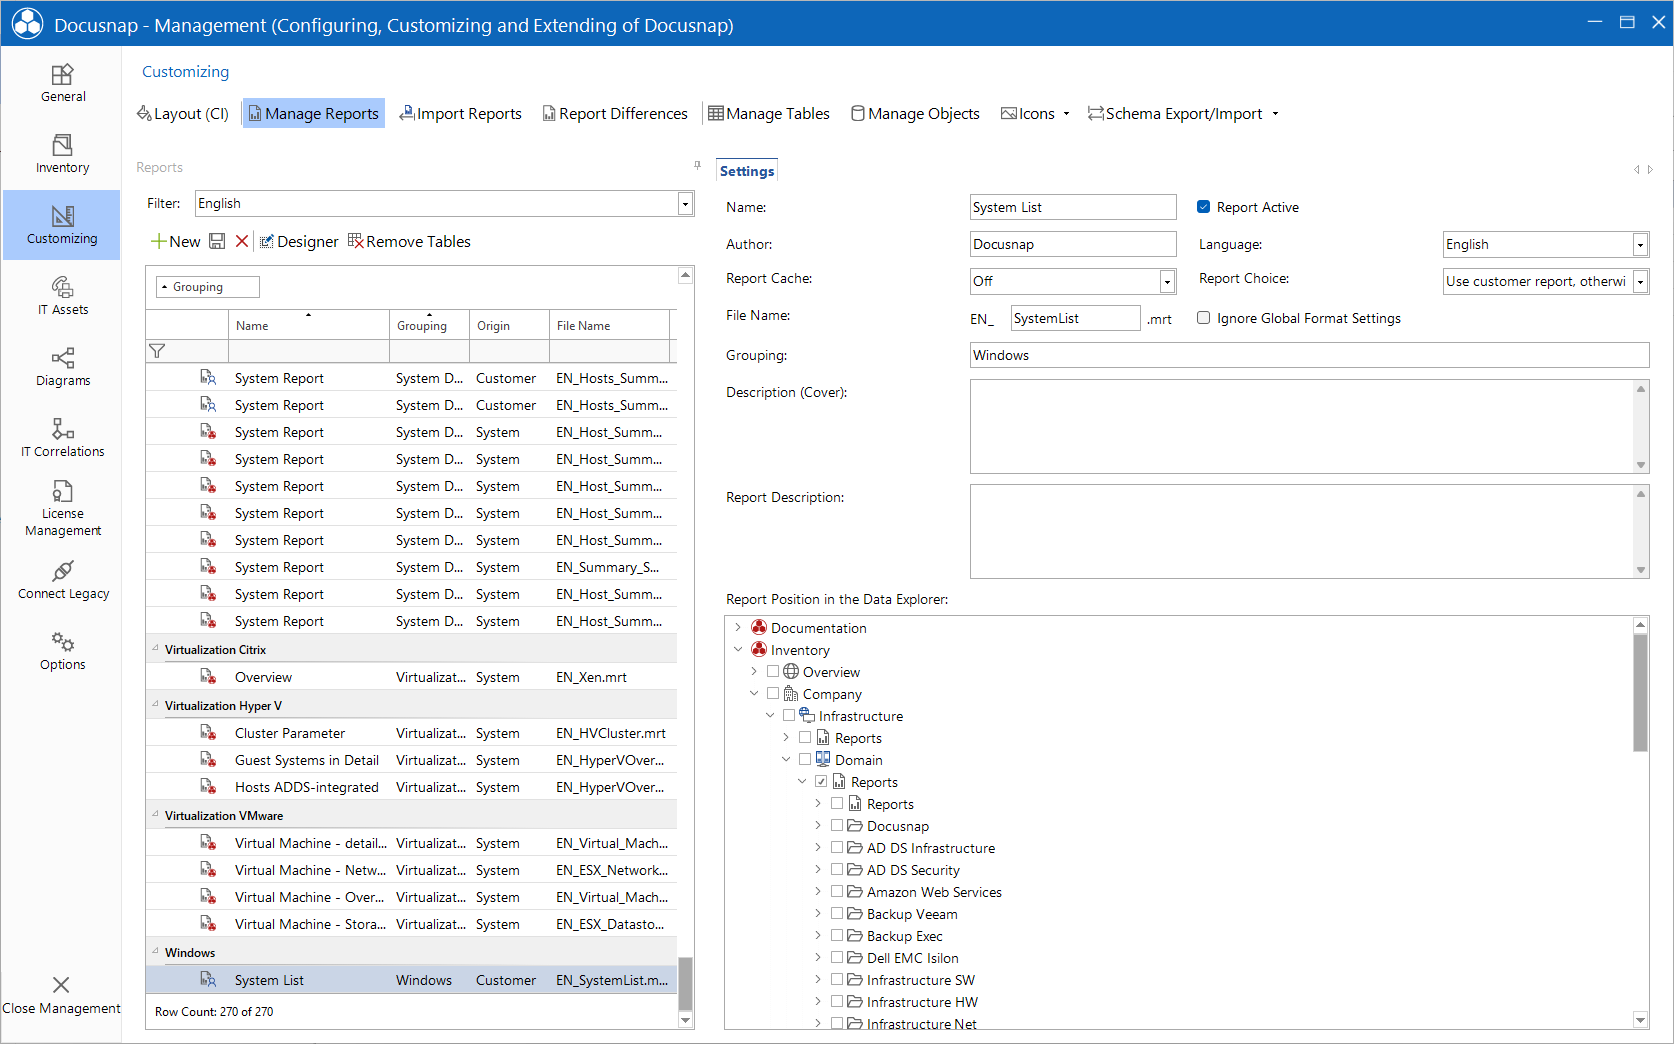
To create a new report, go to Docusnap Management and Manage Reports tab. A new report can be created by clicking the New button. Then, specify the required properties. These properties will be displayed on the cover page.
Linking the Report with a Meta Object
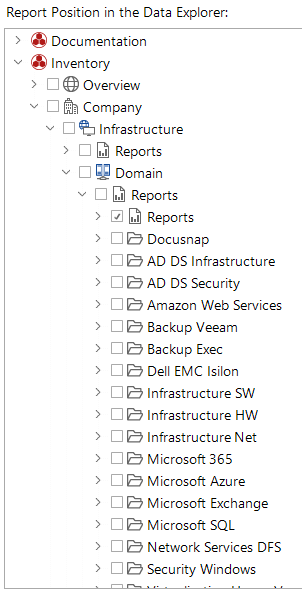
In the next step, you need to select the location in the tree view where the report will be executed. In this case, select the Reports meta object below the domain level. This passes the primary key of the domain to the report, and the report will be displayed below the domain level.
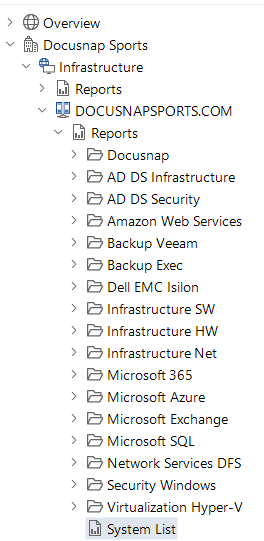
After it has been saved, the report will be displayed in the tree view. To generate/execute this report, click it. This opens the action area. The report can be opened in the Report Designer by clicking the Report Designer button.
Creating a Data Band
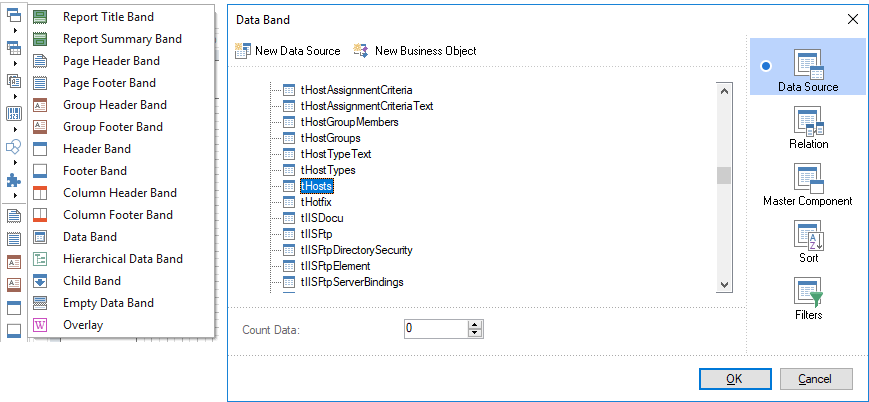
A data band is required for the output of data from the database. Data bands can be added from the Docusnap Bands icon in the Report Designer toolbox. To add a data band, click the Data Band component. For the data source, select the tHosts table.
Adding a Text Box
Text boxes are required to enter values that will be shown in the report. You can combine expressions and table columns in a text box. Text boxes can be added from the toolbox (Text components).
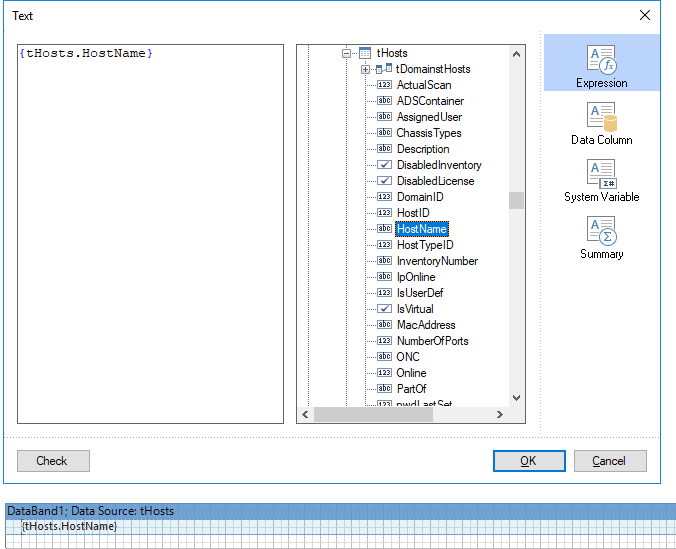
Draw the text box in the data band. In the Text Editor, select the HostName column from the tHosts table.
Connecting the Table
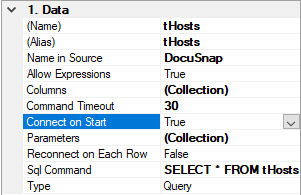
Before the table data can be displayed in the report, you need to connect the table to it. For this purpose, set the Connect On Start property of the table to True.
Creating a Header Band
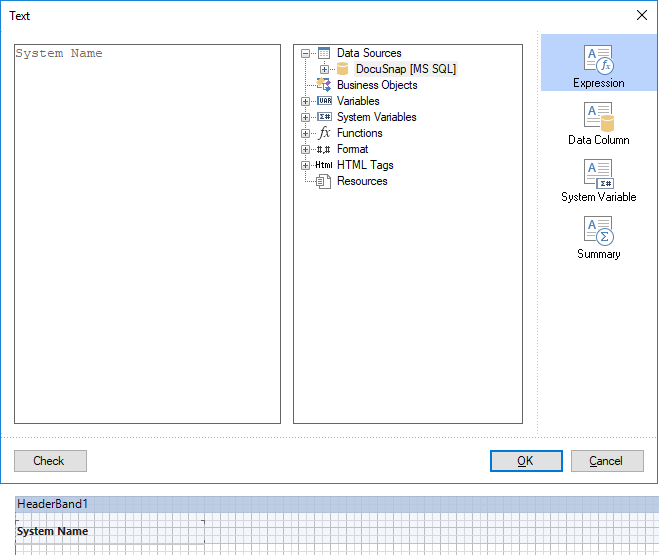
The header contains the headings for the data. The header band will only be displayed if the data band contains data. First, add a Header Band component from the toolbox. Use drag and drop to place the header band before the data band. Then, add a text box and enter the heading.
Primary Key
The primary key is stored in the PrimaryKey variable. The primary key of the associated meta object is used as the primary key. By means of this value, the data for the report can be filtered on the associated object. This means that only data is included in the report that is associated with that computer, domain, license group, etc. The variable will be set when you execute the report.
Filtering on the primary key can be done in two ways, either via the data band or directly using an SQL statement.
Specifying the Primary Key in the Data Band
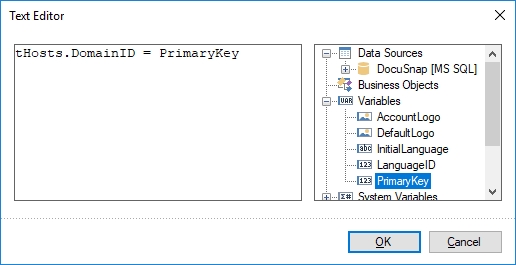
You can define a filter for a data band. Open the dialog by double-clicking the data band. To define a filter, open the Filters page and click Add Filter. Then, change the option for Field Is from “Value” to “Expression”. A click on the  button will open the text editor. Enter the filter condition in this dialog. It is also possible to enter the filter condition directly in the expression field of the Data Setup dialog. The advantage of the text editor is that you can add the column names by double-clicking them.
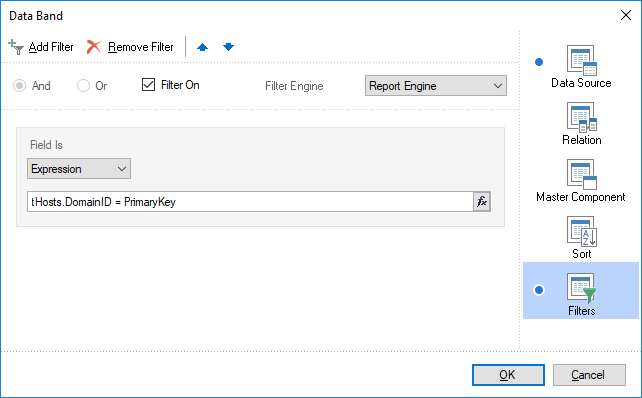
To the right of the text editor, the contents of the dictionary are displayed. You can add the desired column by double-clicking it or by using drag & drop. Then, enter an equal sign ("="). Next, you need the PrimaryKey variable. You can find it under the Variables node. Add it by double-clicking or using drag & drop again. Confirm your filter settings by clicking OK.
Specifying the Primary Key Using an SQL Statement
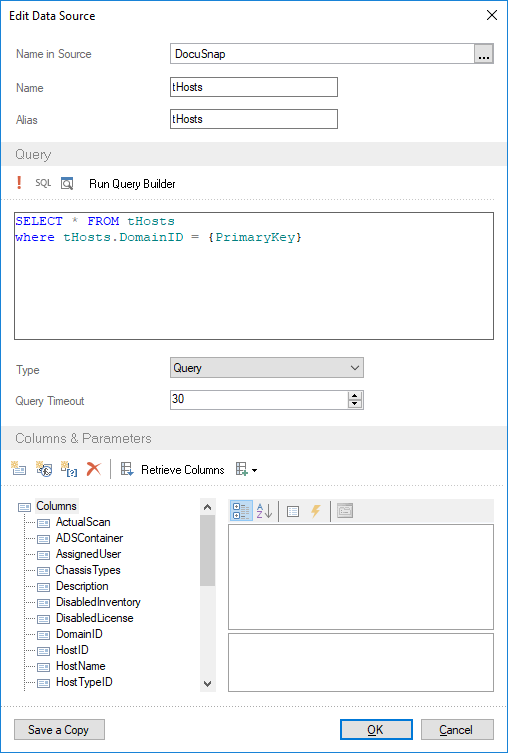
Filtering on the primary key can also be done by specifying an SQL statement for the table. Only data that corresponds to the primary key will be included in the report.
To edit the data source, go to the Dictionary tab, select the table, right-click and select Edit. Then, you can create an SQL statement with a filter on the primary key using a Where clause. The result is that only data that matches this primary key will be shown in the report.
Primary Key: Filter vs. SQL Statement
The advantage of the SQL statement over a filter will become apparent in the speed of execution of the report when large data sets need to be accessed. When you use a filter, all data in the table will be retrieved from the database. Then, Docusnap determines the data output by means of the filter. If you filter the database using an SQL statement, only the data that matches this SQL statement will be retrieved. This reduces the execution time of the report as less data must be loaded.