Components and Functions
11 minute read
Before continuing with the creation of the report, you will now be introduced to working with data bands and text boxes. In addition, a brief explanation of the functions that are available for reports will be provided.
Bands
Bands are key components of a report. Via data bands, you establish the connection to the database. In addition, they can be used to sort and filter the data. Data bands can be added from the toolbox. They fulfill a variety of tasks. Each band has a different color to make them more distinctive.
- Data band: The data band connects your report to the database. When you create a data band, the dialog for selecting the data source, relation, master component, sorting, and filtering conditions opens. From this dialog, you can select the data source. The data band is repeated as often as corresponding data is available in the table. You can restrict the amount of data to be included in the report by specifying relations and filters.
- For a relation, you need to select a master component. This ensures that only data that matches this master component will be shown. A relation must exist between the tables selected for the data band and for the master component. When you create a new data band or double-click an existing data band, a dialog opens. From this dialog, you can select the relation and the master component. The report shows the first record from the master component and then immediately below it, the associated records from the sub-component. Then, the next record from the master component is shown and again the associated records from the sub-component. This pattern is repeated until there are no more master component records. Example: The domains that have been inventoried can be assigned to the company accounts.
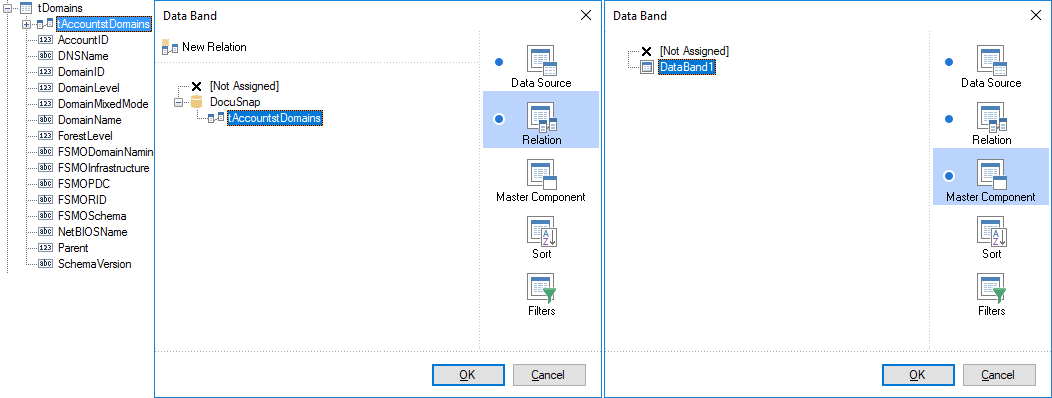
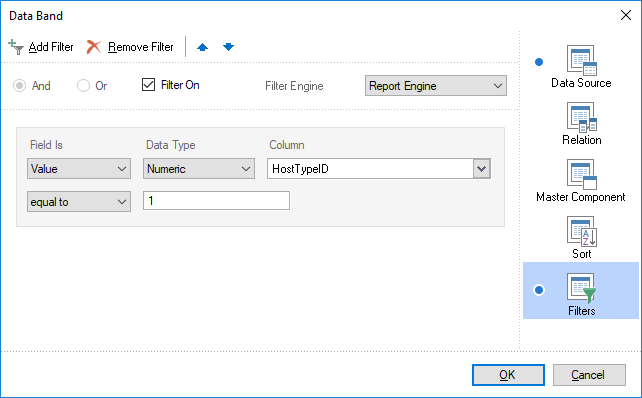
- Filters are used to filter the data on one or more values. When you create a new data band or double-click an existing data band, a dialog opens. From this dialog, you can define the filter. If required, you can specify multiple filters that can be combined using either And or Or operator.
Header Band: The header band, the page header band and the report title band can be used to show headings and titles/headings at the desired position in the report. The header band provides the headings for a specific data band. The header band is shown before the data of the associated data band. If the data band is empty, the header band will not be displayed either. The page header band is shown on every page, and the report title band is shown only once, i.e. at the beginning of the report.
Footer Band: The footer band, the page footer band and the report summary band are the closing items of the associated data display. The footer band is shown after the data of the data band. The page footer band appears at the bottom of each page, and the report summary band at the end of the report.
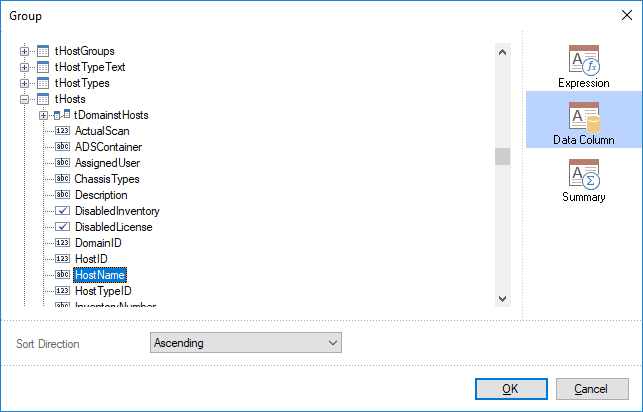
Group Header Band: Using a group header band, you can group data of a table. For instance, the data can be grouped by operating systems. When you add a group header band, the dialog for entering the group condition opens. Here, you can select the column that controls the grouping and you can specify the desired sort order for the data. Then, a separate data band must be defined for the remaining data. In the heading, the value selected in the condition will be shown and the data will be grouped accordingly. Make sure to add a data band after the group header band. Otherwise, the group header band will not be displayed either.
Group Footer Band: This band can, e.g., be used to draw a line below the group. However, it is also possible to calculate the number of records.
Column Header Band: The data in the data bands can be shown in columns. The column header band is automatically divided into as many columns as the associated data band has.
Column Footer Band: This band is the closing item of a data band consisting of multiple columns.
Hierarchical Data Band: This band enables you to display a recursive table. A recursive table has a column that depends on another column in the same table, for example, a list of employees where one employee may be the manager of another. The properties for the hierarchical data band include a group of Hierarchical properties. In the Key Data Column field, you can specify the column that contains the key for the data. In the Master Key Data Column field, you can specify the column to which the hierarchy refers. The Parent Value field allows you to enter a value that indicates the top of the hierarchy.
Child Band: This band is an extension of its parent band. Even though it is possible to place multiple data fields from the tables in a single data band, the size of the data band does not adjust as desired when you change the font size. For this reason, child bands are used. The color of the child band is slightly lighter than the color of its parent data band.
Text Boxes
Text boxes can be used to show the headings and data of your report. When you add a text box, the Text Editor opens. In the Text Editor, you can either add fields from the database or enter text.
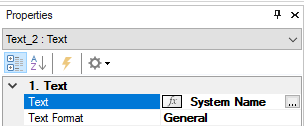
- Heading: The heading for the data is text that has been entered manually. You can enter this text in the Text Editor. To apply the text to the text box, click the OK button. Alternatively, open the Properties tab where you can enter the text in the Text field. To open the Text Editor, either click the
 icon or double-click the text box.
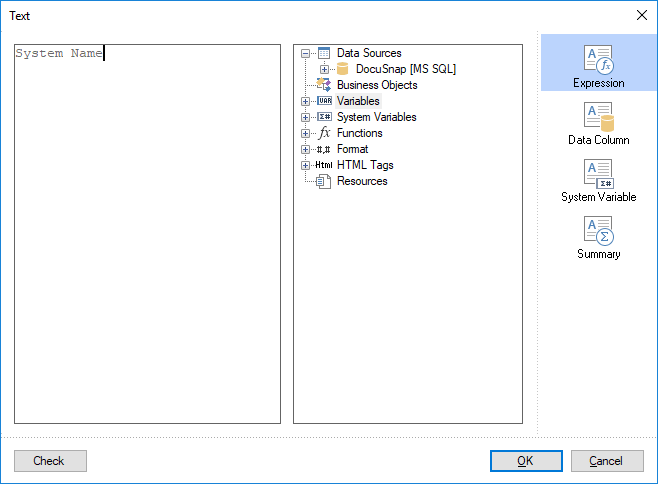
- Data: If you want to output data in a text box, place the text box on a data band, a group header band, a hierarchical data band or a child band belonging to another data band. In addition, the data source for the band must match the table associated with the column. Otherwise, there is no connection to the database and the data from the database cannot be shown. In the Text Editor, you can select the data fields either on the Expression or the Data Column page. To add a field from the Expression page, double-click it. On the Data Column page, click the desired field. Then, click the OK button to apply the selected data field to the text box.

- Expression: In text boxes, data fields and text may be combined. In this case, you can only use the Expression page. When using the Expression page, you can enter a name that will precede the data column. Make sure to place such a text box on a data band, a group header band, a hierarchical data band or a child band belonging to a data band. Furthermore, the data source for the band must match the table associated with the column. Otherwise, the data from the database cannot be shown, because there is no connection to the database.
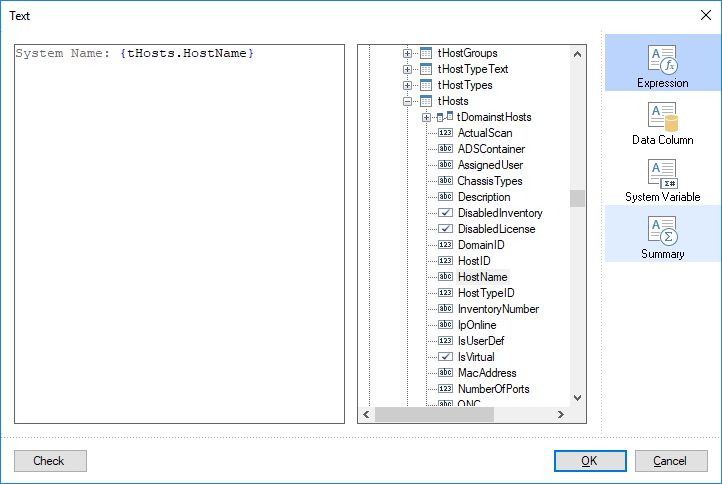
- Functions: In addition to data fields and text, you can specify functions to be included in a text box. The functions available in Docusnap will be explained in the Functions section.
Rich Text
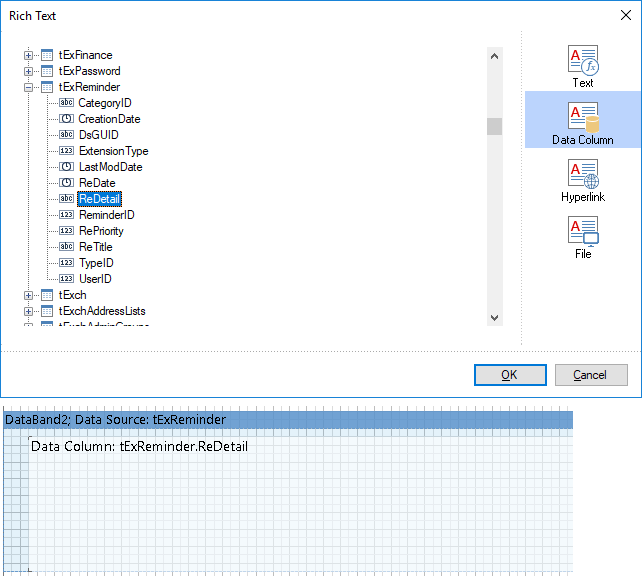
For data entry screens, it is possible to create rich text boxes. In order to show the format settings of these fields in the report as well, you need to define a corresponding rich text box in the report. Rich text boxes can be moved and handled just like text boxes. The difference between a rich text box and a normal text box is that the data column to be included in the report will not be entered in the field, but rather specified from the Properties tab. You can select the data column by setting the Data Column property on the Properties tab. The text will only be displayed with the selected format settings if you specify the data column through this property.
Functions
Docusnap provides several functions for reports.
General Functions
- DsLookup: Many tables contain only numbers. To express these numbers as words, the tSysInitials table from the Docusnap database can be used. In this table, the states of services and computers, the computer types, the countries, and other information are stored as literals. The InitialFilter column contains the values stored in the respective tables. The DsLookup function can be used to show the values from these tables as words. Enter this function into a text box located in a data band. The function must be surrounded by braces “{}”, otherwise the Designer will not recognize it as a function. Thus, the form of the function is:
{DsLookup(ColumnName,"InitialFilter")}. The column name represents the value in the table that should be replaced with the literal. “InitialFilter” is the word that exists in the InitialFilter column of the tSysInitials table. Thus, if you want to display the online status for the tHosts table, enter the following function:{DsLookup(tHosts.Online,"OnlineStatus")}.

DsSortIPAddress: If you wish to sort a data band by IP addresses, the number blocks with less than three digits need to be left-padded with zeros. This means that if you want to sort the data in a data band by IP addresses, precede the name of the IP address column with the
{DsSortIPAddress(ColumnName)}function. This function is used by the IP Addresses report.DsGetDateFromTimeStamp: The date from certain Active Directory properties, such as the creation date, is stored as a timestamp. To convert the timestamp into a readable format, the
{DsGetDateFromTimeStamp(ColumnName)}function is used. This function is used by the ADS Docu User report.DsPlainTextRTF: If you enter your text in a rich text box, the formatting is stored along with the actual text in the database. The DsPlainTextRTF function allows you to output the plain text in a text box, without considering the formatting.
{DsPlainTextRTF(ColumnName)}DsGetSIDName: If the User/Group Selection component is used in input screens, the SID of the selected AD user or AD group is stored. There are also cases where the SID of an AD user or AD group is inventoried during the inventory. To display the corresponding AD user or group instead of the SID, the function DsGetSIDName is available. The AD inventory is used to resolve the SID. The function requires the SID and AccountID of the company where the AD inventory is located.
{DsGetSIDName(Column Name,AccountID)}
Permissions
DsAccessMask and DsACEFlag: These are special functions to determine the access mask or the ACE flags when scanning the permissions. These fields are located in the tACL table of the database.
{DsAccessMask(ColumnName)}{DsACEFlag(ColumnName)}

GetBit: Using the GetBit function, you can individually evaluate the users’ permissions to the directories. To show the permissions in a report, you can use the
{GetBit(ColumnName,Bit)}function. For this purpose, the Permission column is used as the column name. For the Bit argument, enter the number that corresponds to the required permission. If the user has this permission, an “x” will be returned; otherwise, a space. This function is used in the User (Resource), Directory (Resource) and Permission Analysis - Current View reports.- Permissions and their Numeric Equivalents
- 0 = Read
- 1 = Write
- 2 = Create directories
- 3 = Read extended attributes
- 4 = Change extended attributes
- 5 = Execute
- 6 = Delete subdirectories
- 7 = Read attributes
- 8 = Change attributes
- 16 = Delete
- 17 = Read permissions
- 18 = Change permissions
- 19 = Owner
Share Permissions: For the output of share permissions, three functions are used. These are
{IsFullAccess(ColumnName)}for full access,{IsChangeAccess(ColumnName)}for change access and{IsReadAccess(ColumnName)}for read-only access. Use the Permission column from the tSharePermission table as the column name. If the user has the respective share permission, an “x” will be returned; otherwise, a space.
Extensions
- DsGetObjectDisplayValue: Outputs an object linked with an extension. The values are stored in the tExtensions table and in the table for the respective extension, i.e. tExComment, tExContract, tExFinance, tExPassword and tExReminder. The syntax of this function is:
{DsGetObjectDisplayValue(ObjectId, ObjectType)}

Exchange Server
To display permissions of public folders, mailbox folders, and mailboxes of the Exchange Server, the functions AreBitsSetX, AreBitsSet, and AreBitsNotSet are used. Column names are these columns.
tExchangePublicFolderPermission.ExchangePublicFolderPermission
tExchangeMailboxPermission.ExchangeMailboxPermission
tExchangeMailboxFolderPermissions.MailboxPermissions
AreBitsSetX: To output the permissions, the function
{AreBitsSetX(columnname,bits)}is used. The bit is a number or multiple numbers, each corresponding to a permission. If the user has this permission, an ‘x’ is returned, otherwise a space.AreBitsSet and AreBitsNotSet: Some permissions, the permission is composed of set and not set bits. To evaluate this permission, there are the functions AreBitsSet and AReBitsNotSet that return true or false. The following function is used in the report:
{IIF(AreBitsSet(columnname,bits) = true and AreBitsNotSet(columnname,bits) = true, "x", "")}This function returns an ‘x’ if the respective bits were set and not set.
Mailbox Permissions and their Positions
- 22,23,24,25 = Full access
- 22 = Delete objects
- 23 = Read permissions
- 24 = Change permissions
- 25 = Change owner
- 16 = Send as
- 17 = Receive as
- 18 = View Information Store Status
- 26 = Send on Behalf
- 21 = External account
Public Folder Permissions and their Position
- 5 = Folder visible
- 3 = Owner
- 1 = Read elements
- 0 = Create elements
- 7 = Edit own elements
- 9 = Delete own elements
- 6 = Edit all elements
- 8 = Delete all elements
- 2 = Create subfolders
- 4 = Folder contact person
Mailbox folders set and not set Positions and Permissions
| set Bits | bit set Bits | Permissions |
|---|---|---|
| 0,1,2,3,4,5,6,7,8,9 | Owner | |
| 0,1,2,5,6,7,8,9 | 3,4 | Publishing Editor |
| 0,1,6,7,8,9 | 2,3,4,5 | Editor |
| 0,1,2,5,7,9 | 3,4,6,8 | Publishing Author |
| 0,1,5,7,9 | 2,3,4,6,8 | Author |
| 0,1,5,9 | 2,3,4,6,7,8 | Non Editing Author |
| 1,5 | 0,2,3,4,6,7,8,9 | Reviewer |
| 0,5 | 1,2,3,4,6,7,8,9 | Contributor |
Licenses
Docusnap uses functions for license calculations. The value used is the SoftwareID from the tSoftwareProducts table.
Calculating the correction value
{DsLicCorrectionValue(SoftwareID)}Counting the licenses purchased
{DsLicAvailableLicenses(SoftwareID)}Counting the licenses in use
{DsLicFoundCount(SoftwareID)}Calculating the upgrade and downgrade paths
{DsLicPathCorrectionValue(SoftwareID)}